India's Coffee Story
Life can be brew-tiful when there is coffee in it. However, we often do not think about this beverage's socio-economic effects.
Introduction
With this project, I intend to take you through the story of India in the context of its coffee story. I was aware that India is one of the leading exporters of coffee around the world. After reading “The Origins of Coffee in Asia” article at the Kontinentalist website, I was inspired to investigate the difference in revenue earned by farmers compared to big coffee companies.
Personally, without even investigating this topic, I assume that there would be a big divide between the growers’ and sellers’ revenues. Through the data graphs, I want to see if this assumption actually holds true. Next, after some more research, I realized that I have to go through some other steps before calculating and presenting the overall revenues of farmers. With this in mind, I have produced 5 data visualizations.
1. India's Coffee Position
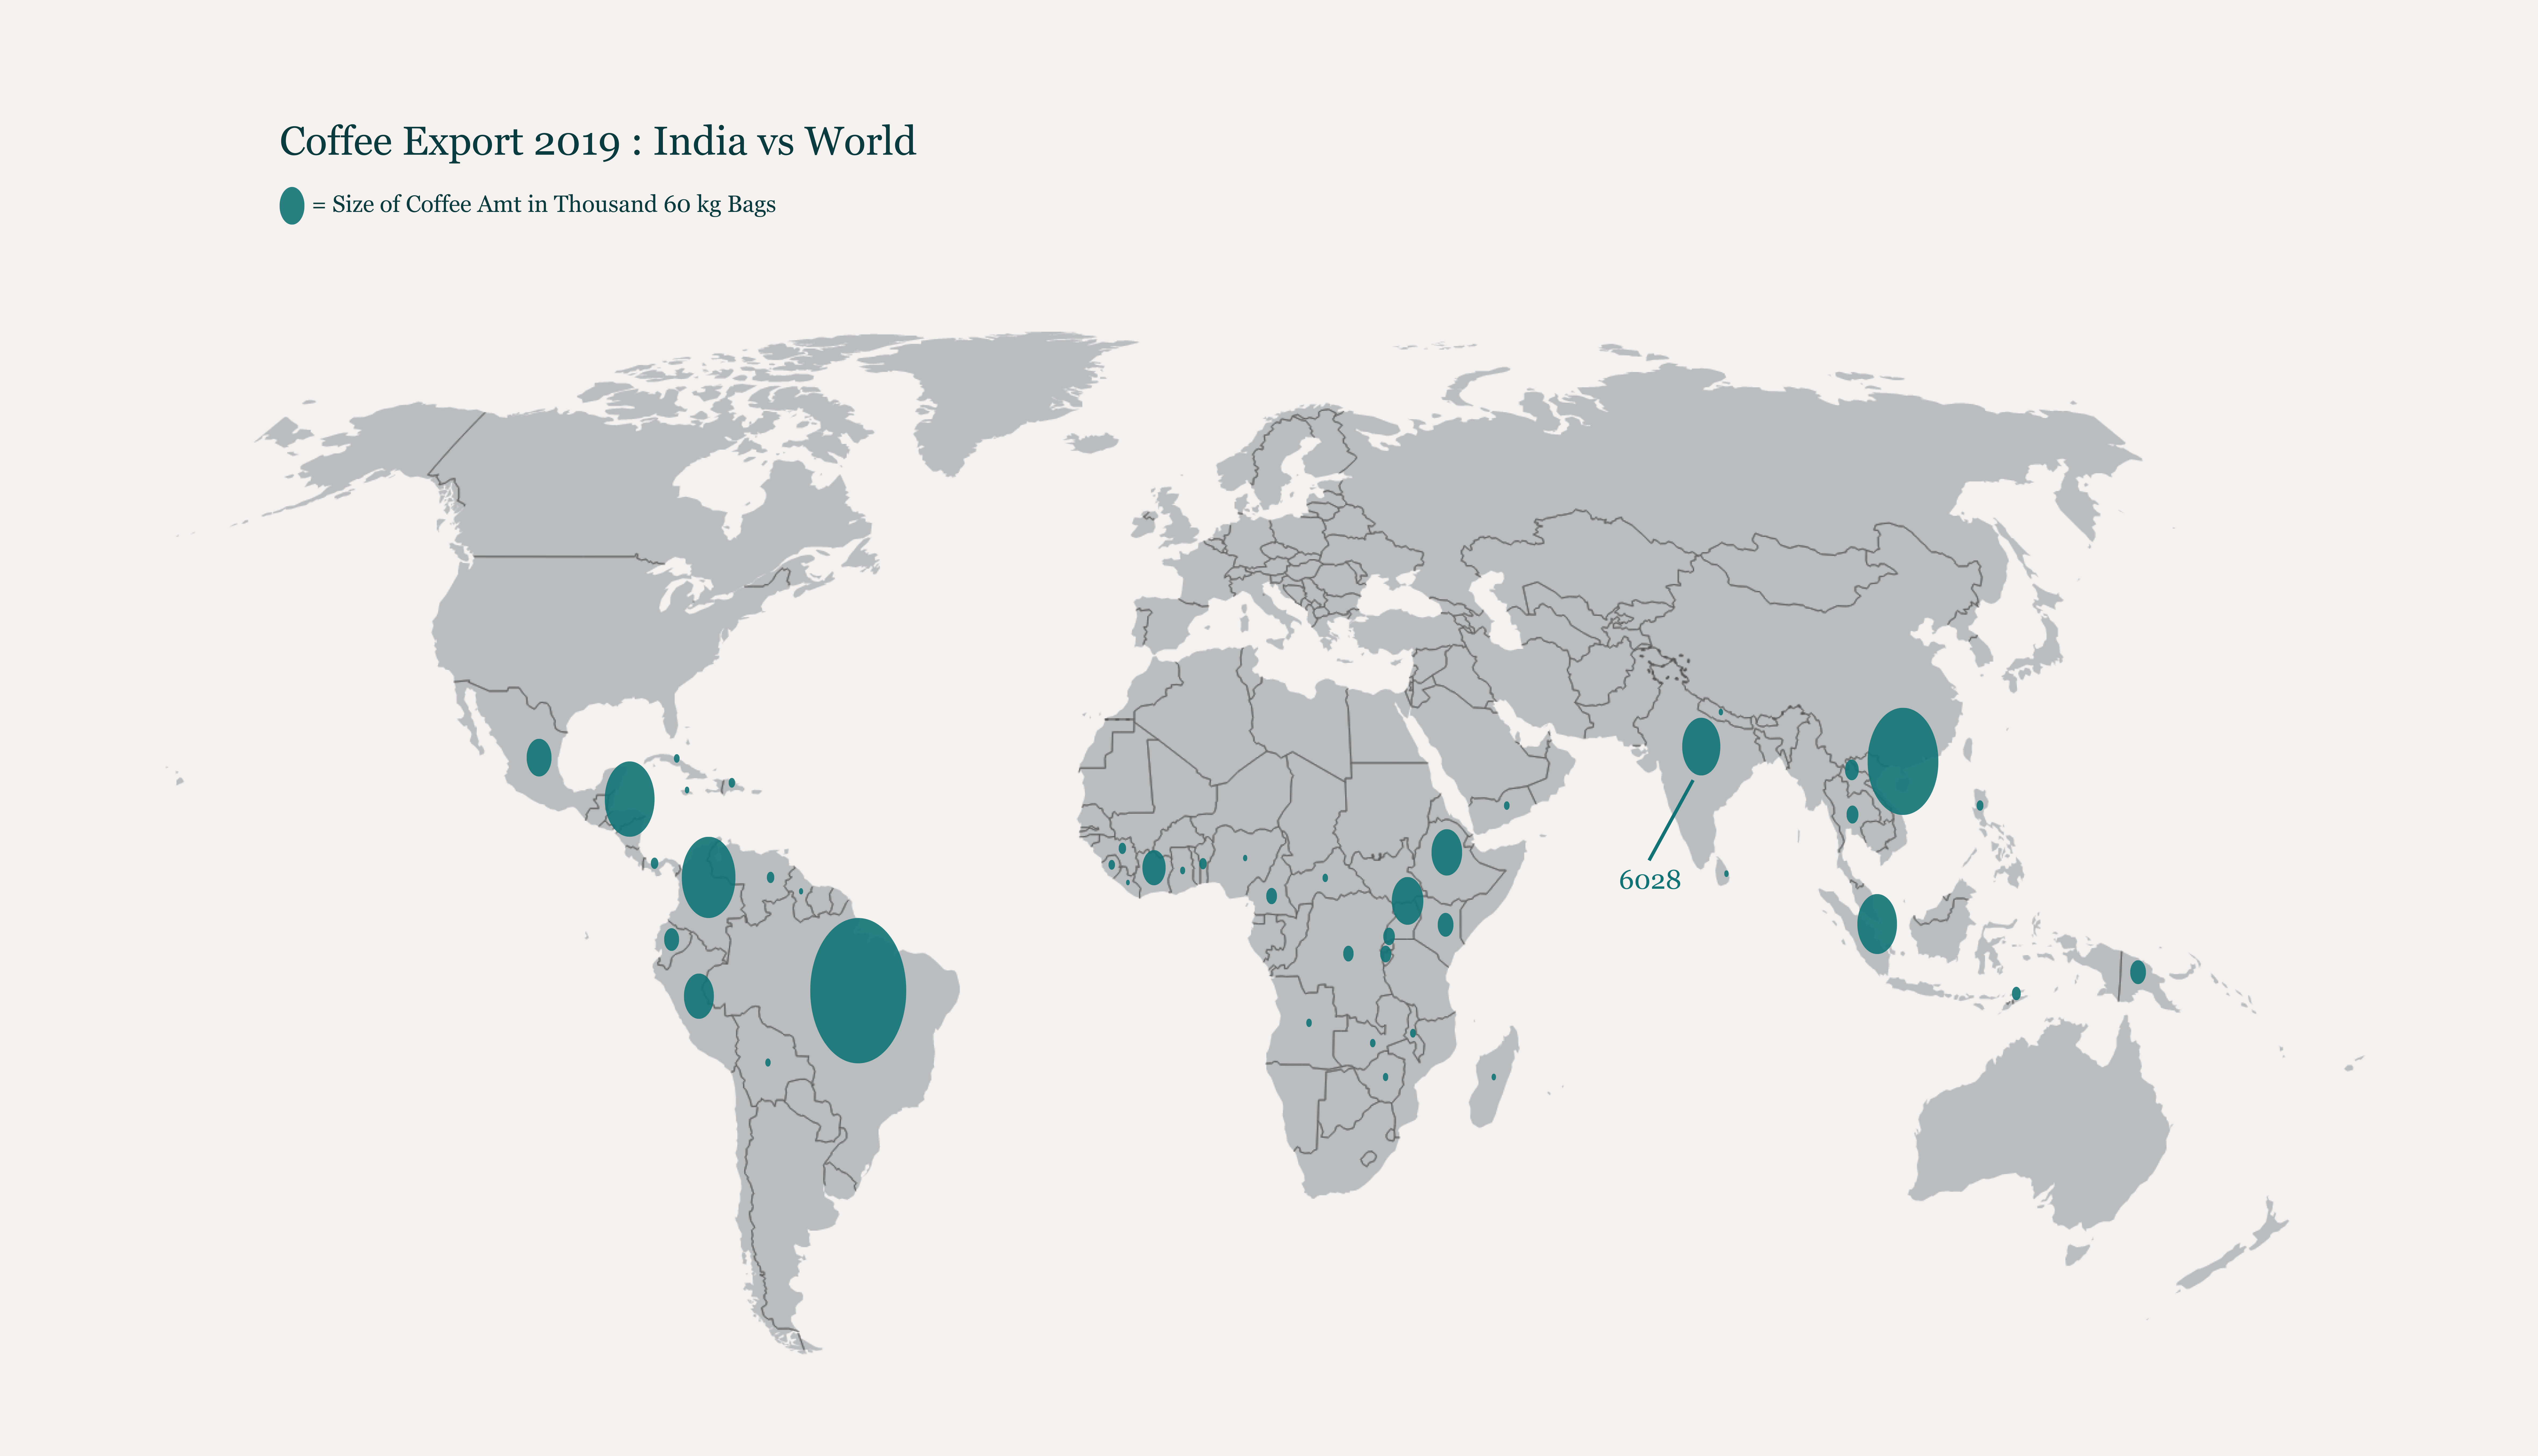
My first goal is to filter India’s position amongst the countries that export coffee around the world. Having found a data set at the ICO (International Coffee Organization), I made this bubble chart to present the export levels across the world map. In total there are 51 countries marked on this map. The coffee quantity is in the ICO’s standard unit of measurement which is in the number of thousand 60 kg bags. Thus, I have used this unit of measurement for all my visualizations.
Findings
India is the 5th largest coffee exporter in the world. The exact export quantity is 6028 thousand 60 kg bags for the year 2019. Although India’s coffee export is quite less compared to the two biggest exporters, Brazil and Vietnam, it is still important due to the number of Indian coffee farmers.
Exactly how many coffee farmers are in India? Out of the 250,000 coffee farmers that exist in the country, 98% are small coffee growers. Furthermore, a secondary finding is that most of the coffee exporting countries are in the southern hemisphere, due to the warm climates needed to grow coffee.
2. India's Largest Coffee Consumer
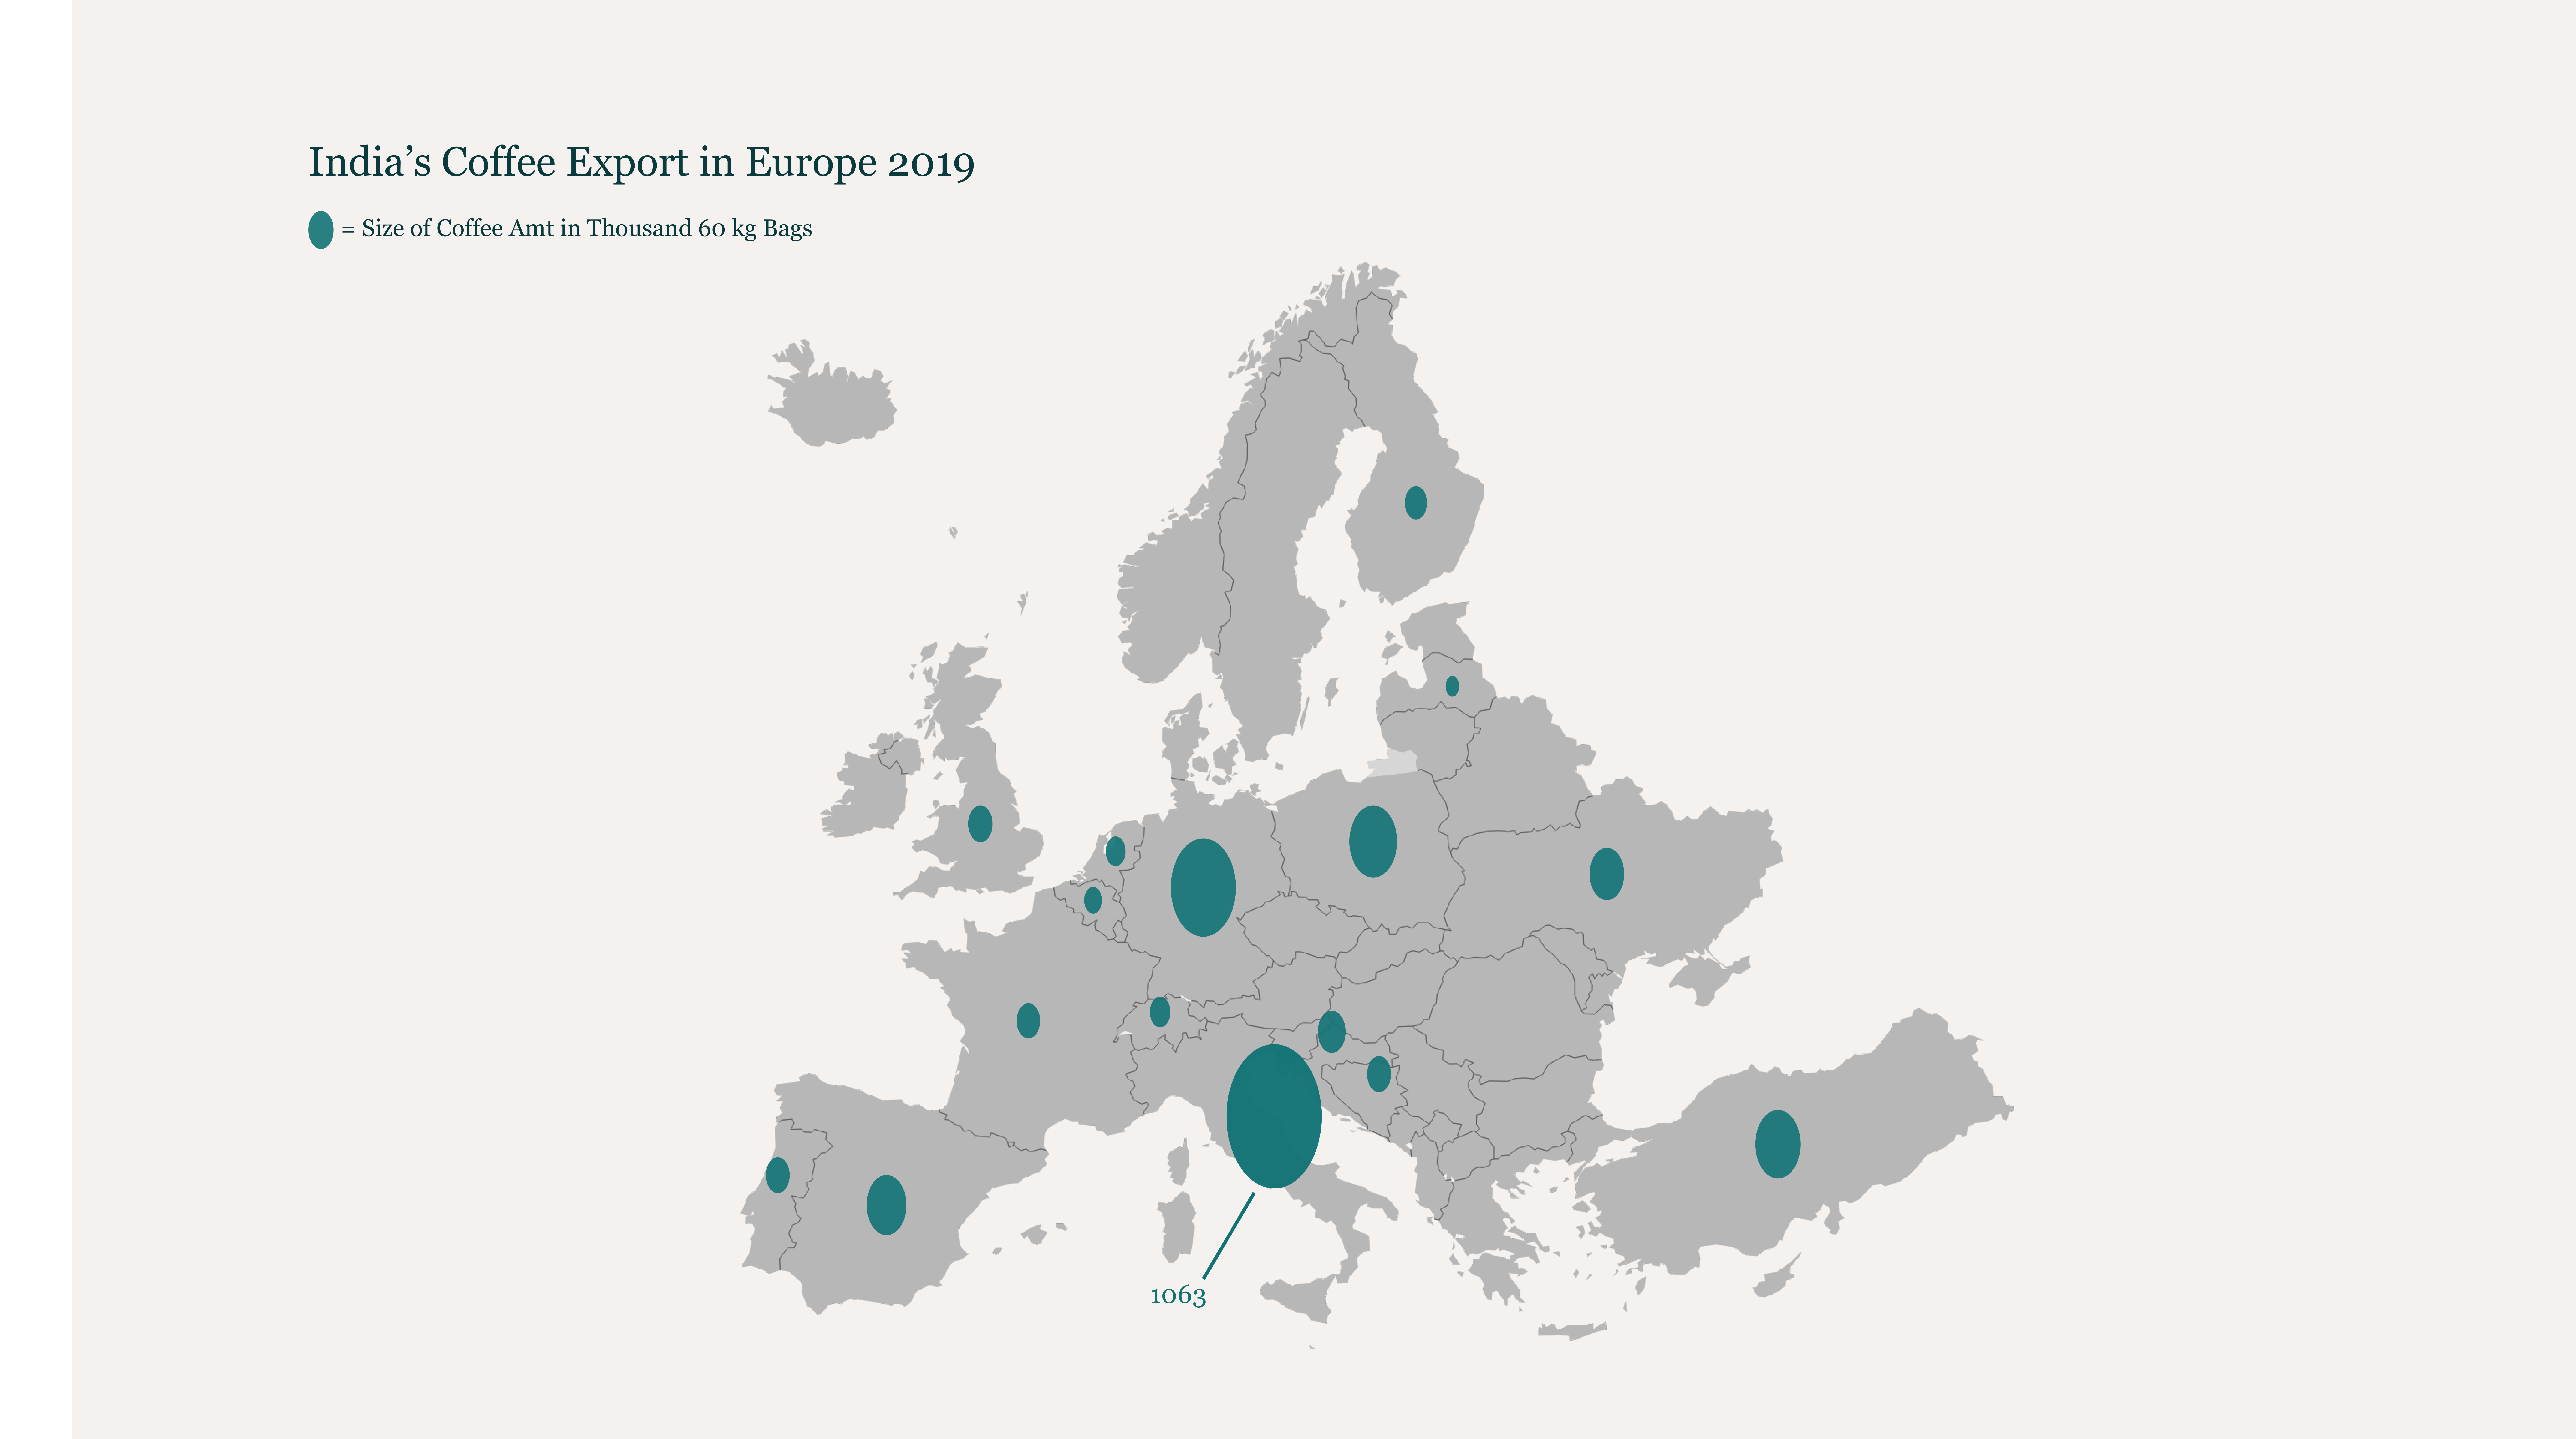
My second goal is to filter India’s leading importing country to potentially find the biggest company that uses Indian coffee. This will require comparing India’s top importers (Russia, Belgium, Italy, Spain, and Germany) all of which are in Europe. Using data from the CEIC website (a reliable micro and macroeconomic data source), I have created a similar bubble chart to the previous one to depict Indian coffee export quantities to countries in Europe. After some conversions of metric tons quantities from the database to ICO’s unit of measurement, I was able to retain consistency.
Findings
Italy is the largest importer of Indian coffee. The exact quantity is 1063 thousand 60 kg bags for the year 2019. So, Italy’s import value would take up the biggest chunk of India’s total exported coffee seen in the previous bubble chart. Other big importers include Germany and Poland.
A secondary finding here would be that a lot of coffee consumption takes place in the Northern Hemisphere, and this chart is a small glimpse of that through an illustration of European countries imports.
3. India's Coffee to Italy
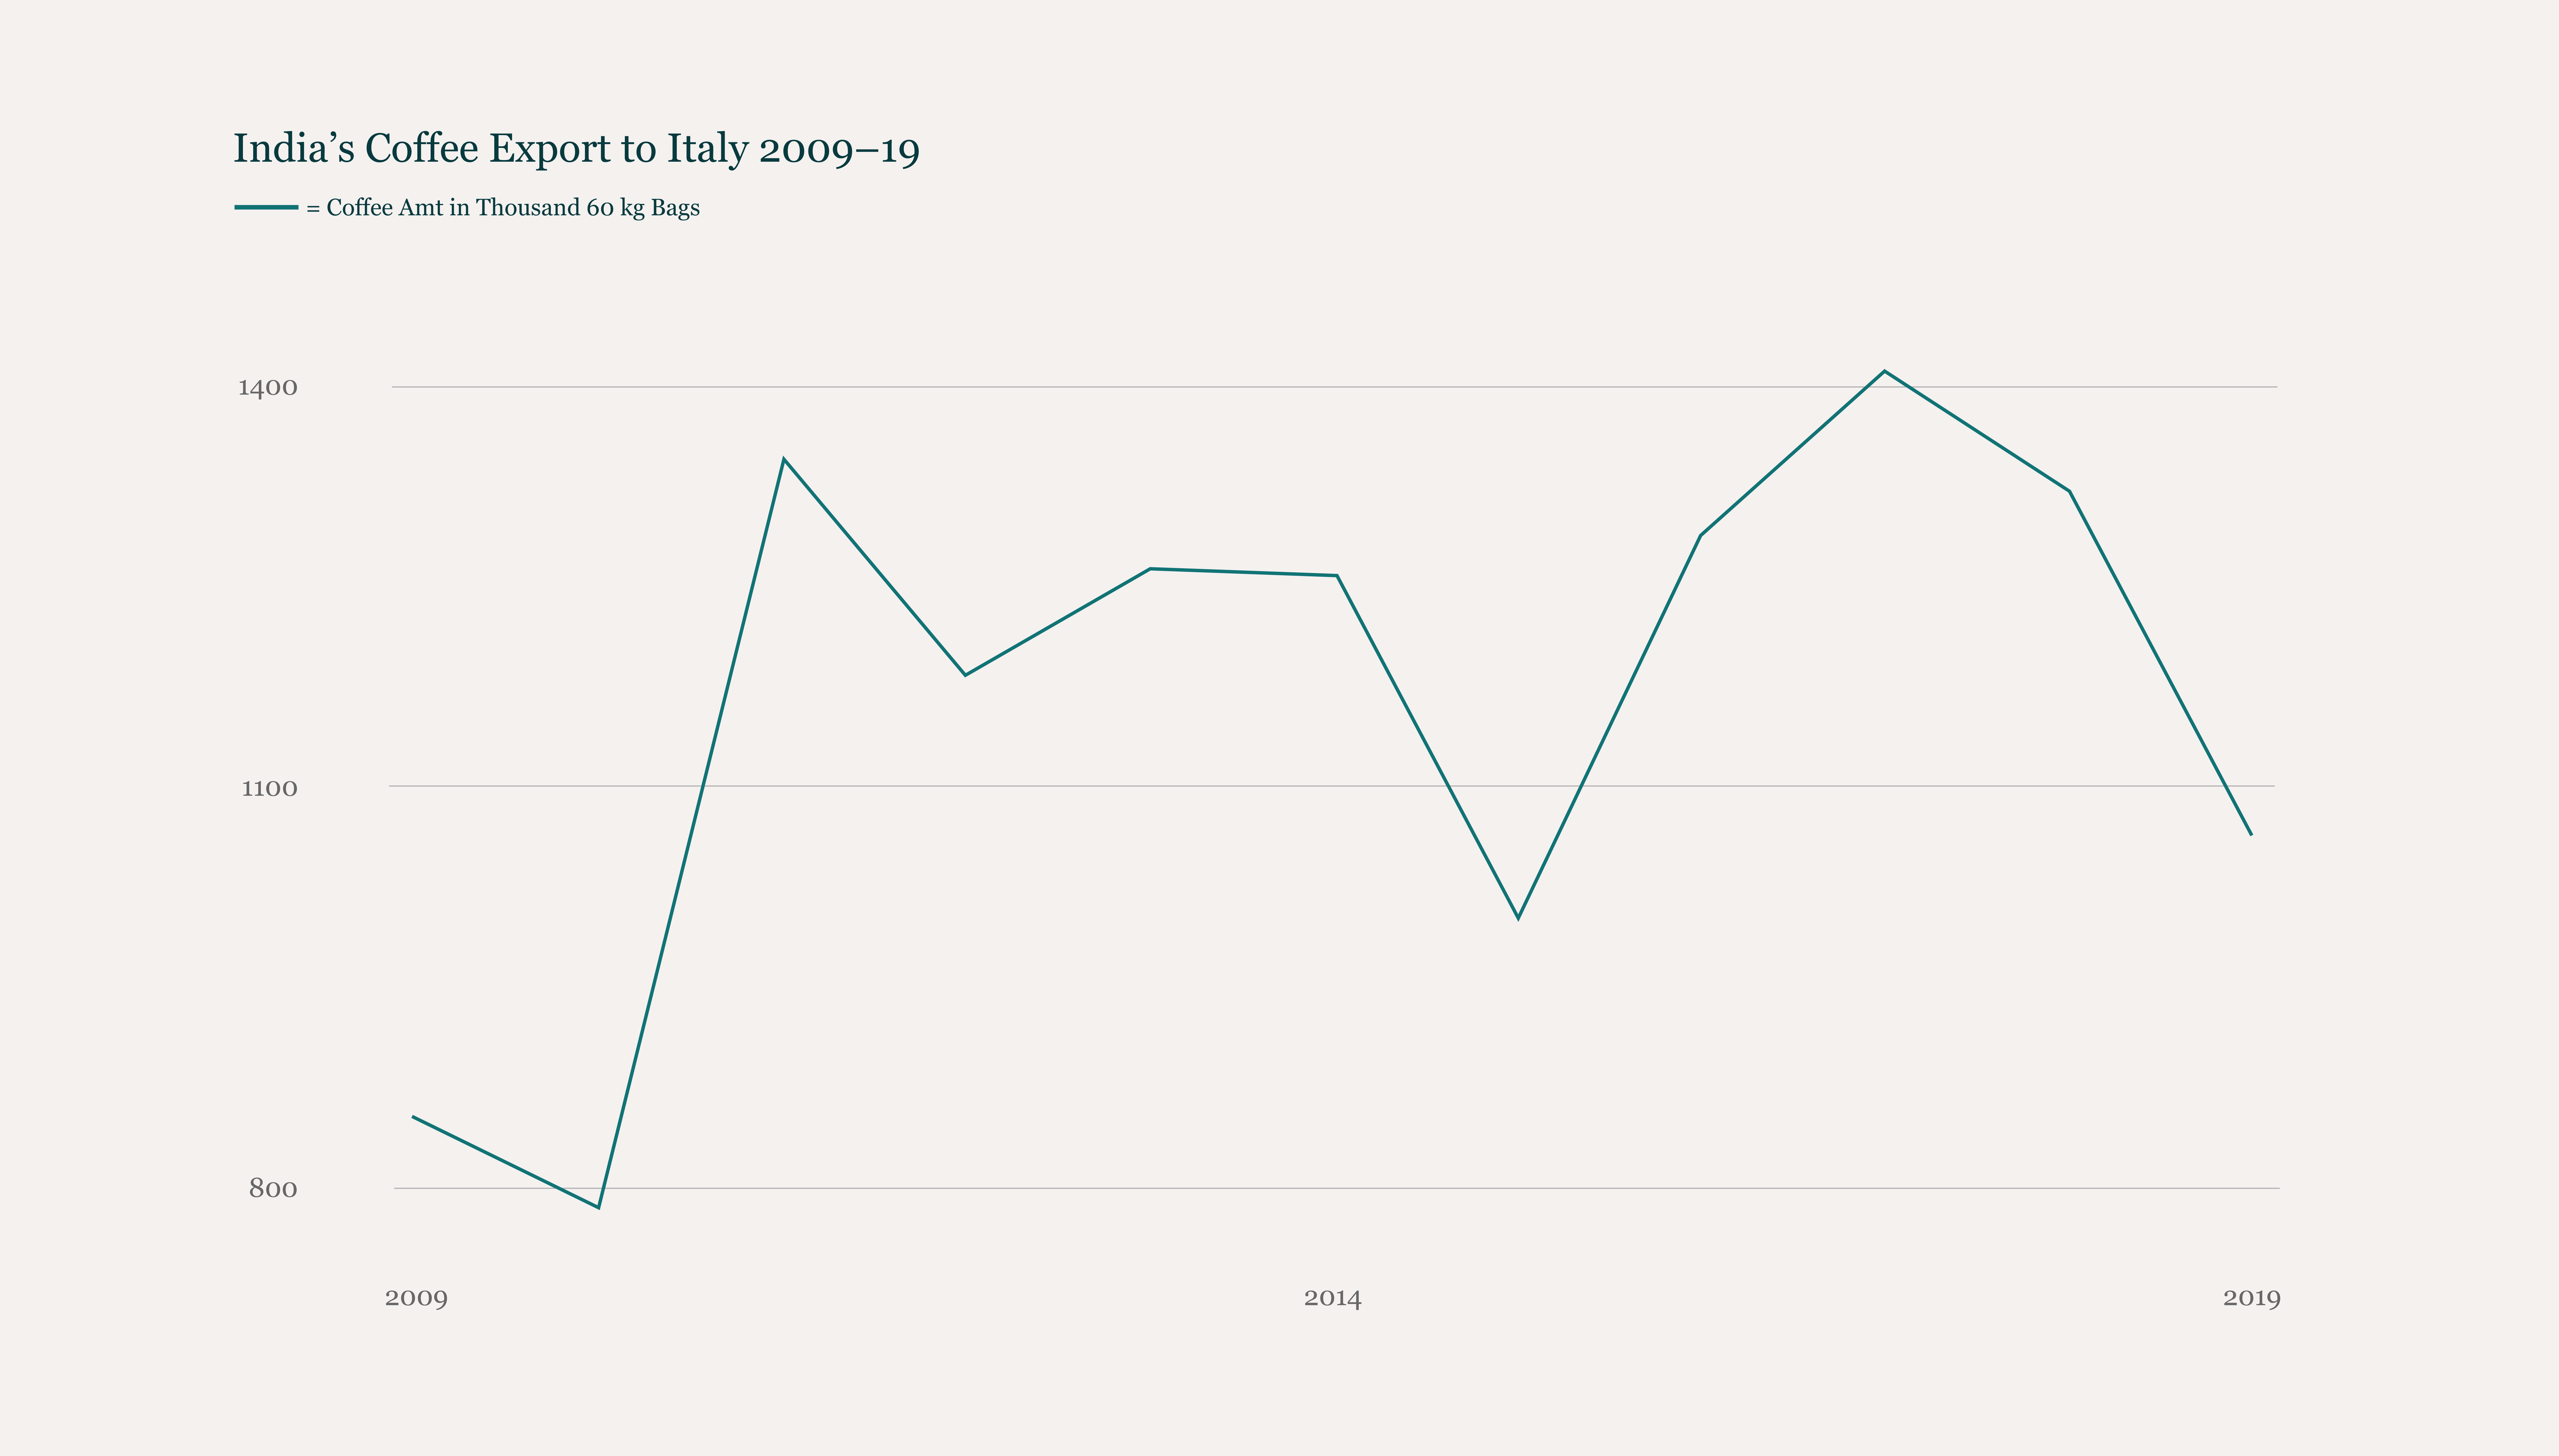
Now that we know Italy is India’s biggest coffee importer, it would be worth investigating exactly how much India has imported to Italy over time. Again, using data from the CEIC website, I have showcased the coffee export levels from India to Italy from 2009 to 2019 via a line graph chart. This type of chart is most appropriate as the data contains physical quantities that change over time. With this data source, I had to convert metric tons to the ICO unit of measurement as well.
Findings
The coffee export levels to Italy increased from the initial 2009 levels and are at their highest level in 2017. The export decreases below 1100 thousand 60 kg bags after that in 2019. If the most recent data available for the export levels have been declining, it is worth pondering how much farmers may earn for these exports.
4. India's Earnings from Italy
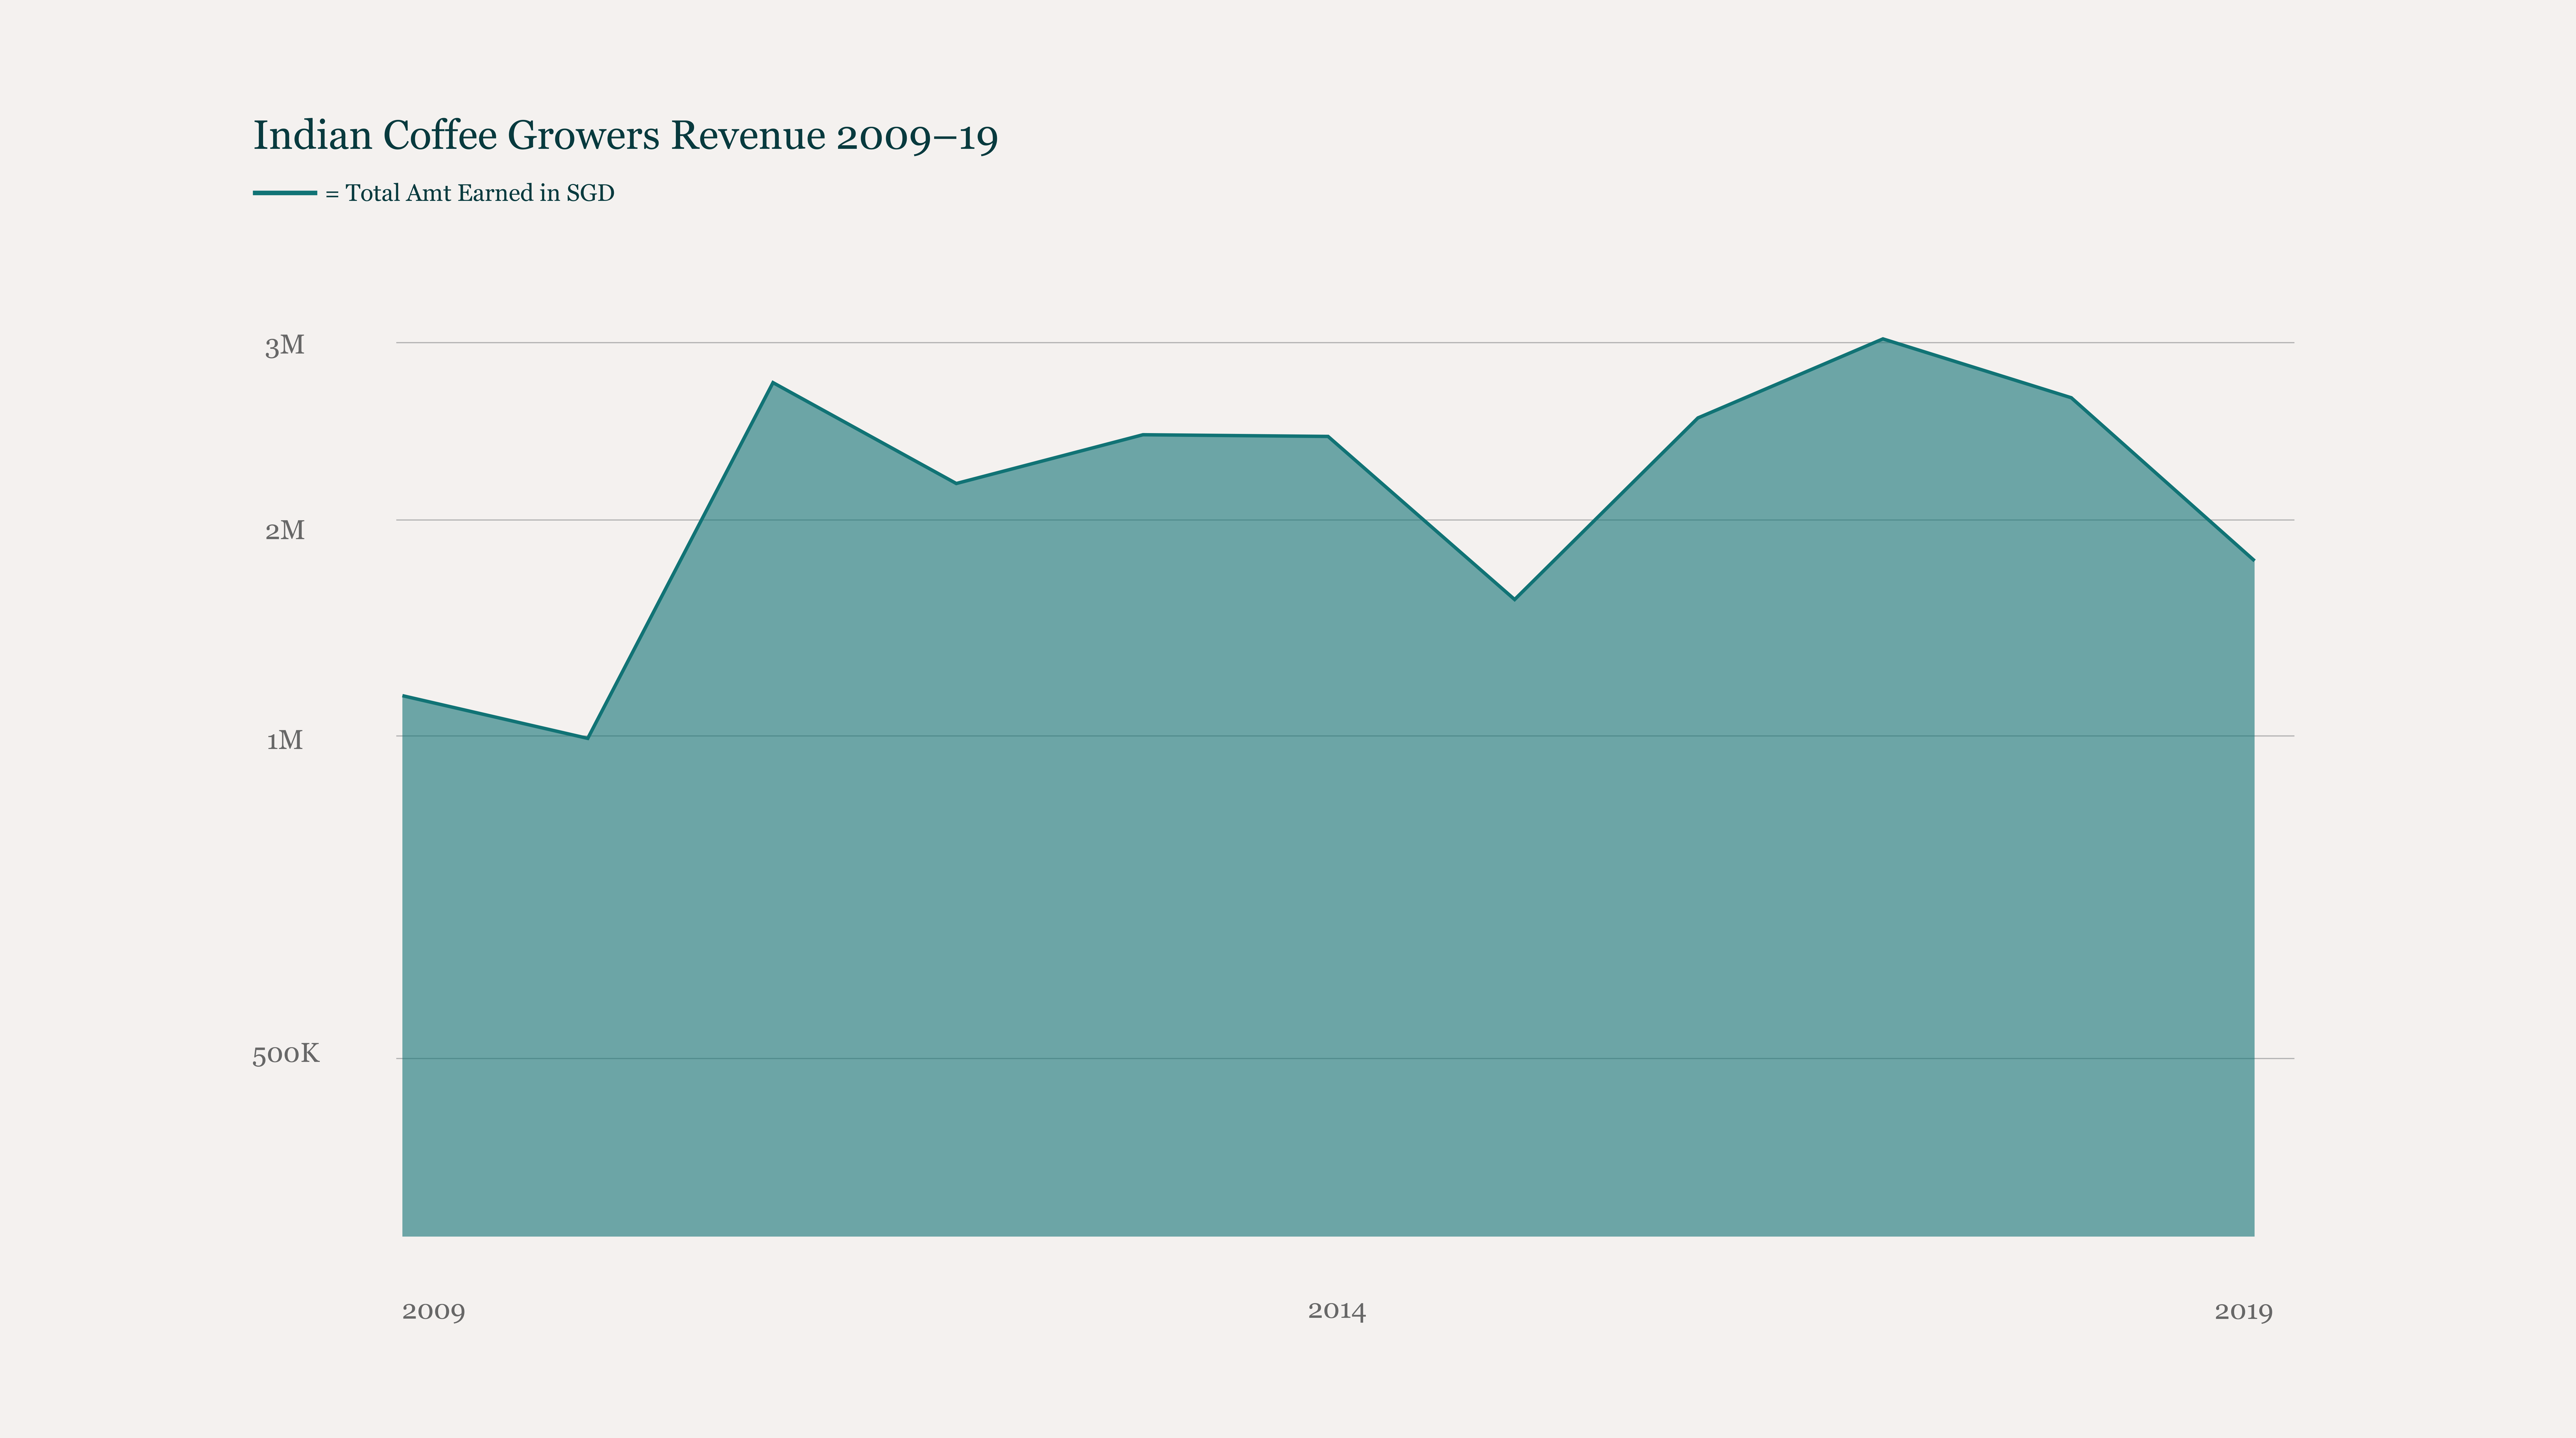
The ICO database only had coffee growers’ earnings in cents/lb values for different years. I converted the cents/lb to thousand 60 kg bags and multiplied it with the export quantities deduced from the previous line graph chart between 2009-2019. Next, I also converted the total coffee growers’ earnings into SGD from the original USD values given as the audience for these visualizations resides in Singapore. I have used a line area graph for this data to quantify money over time. This is because I think that envisioning money quantities can be abstract so the area graph takes up more surface space to aid in quantifying big numerical data.
Findings
The money earned by the coffee growers in India for exports to Italy follows the same pattern as the last line graph with the highest earnings in 2017 after which it decreases towards 2019. So there is an obvious correlation between Indian coffee farmers’ revenue and Indian coffee exports.
Another important thing to note is that these quantities represent the collective revenue of all the coffee farmers in India, approximately 250,000 of them. If this is how much Indian coffee farmers earn, how much might big coffee companies earn?
5. Battle of the Revenues
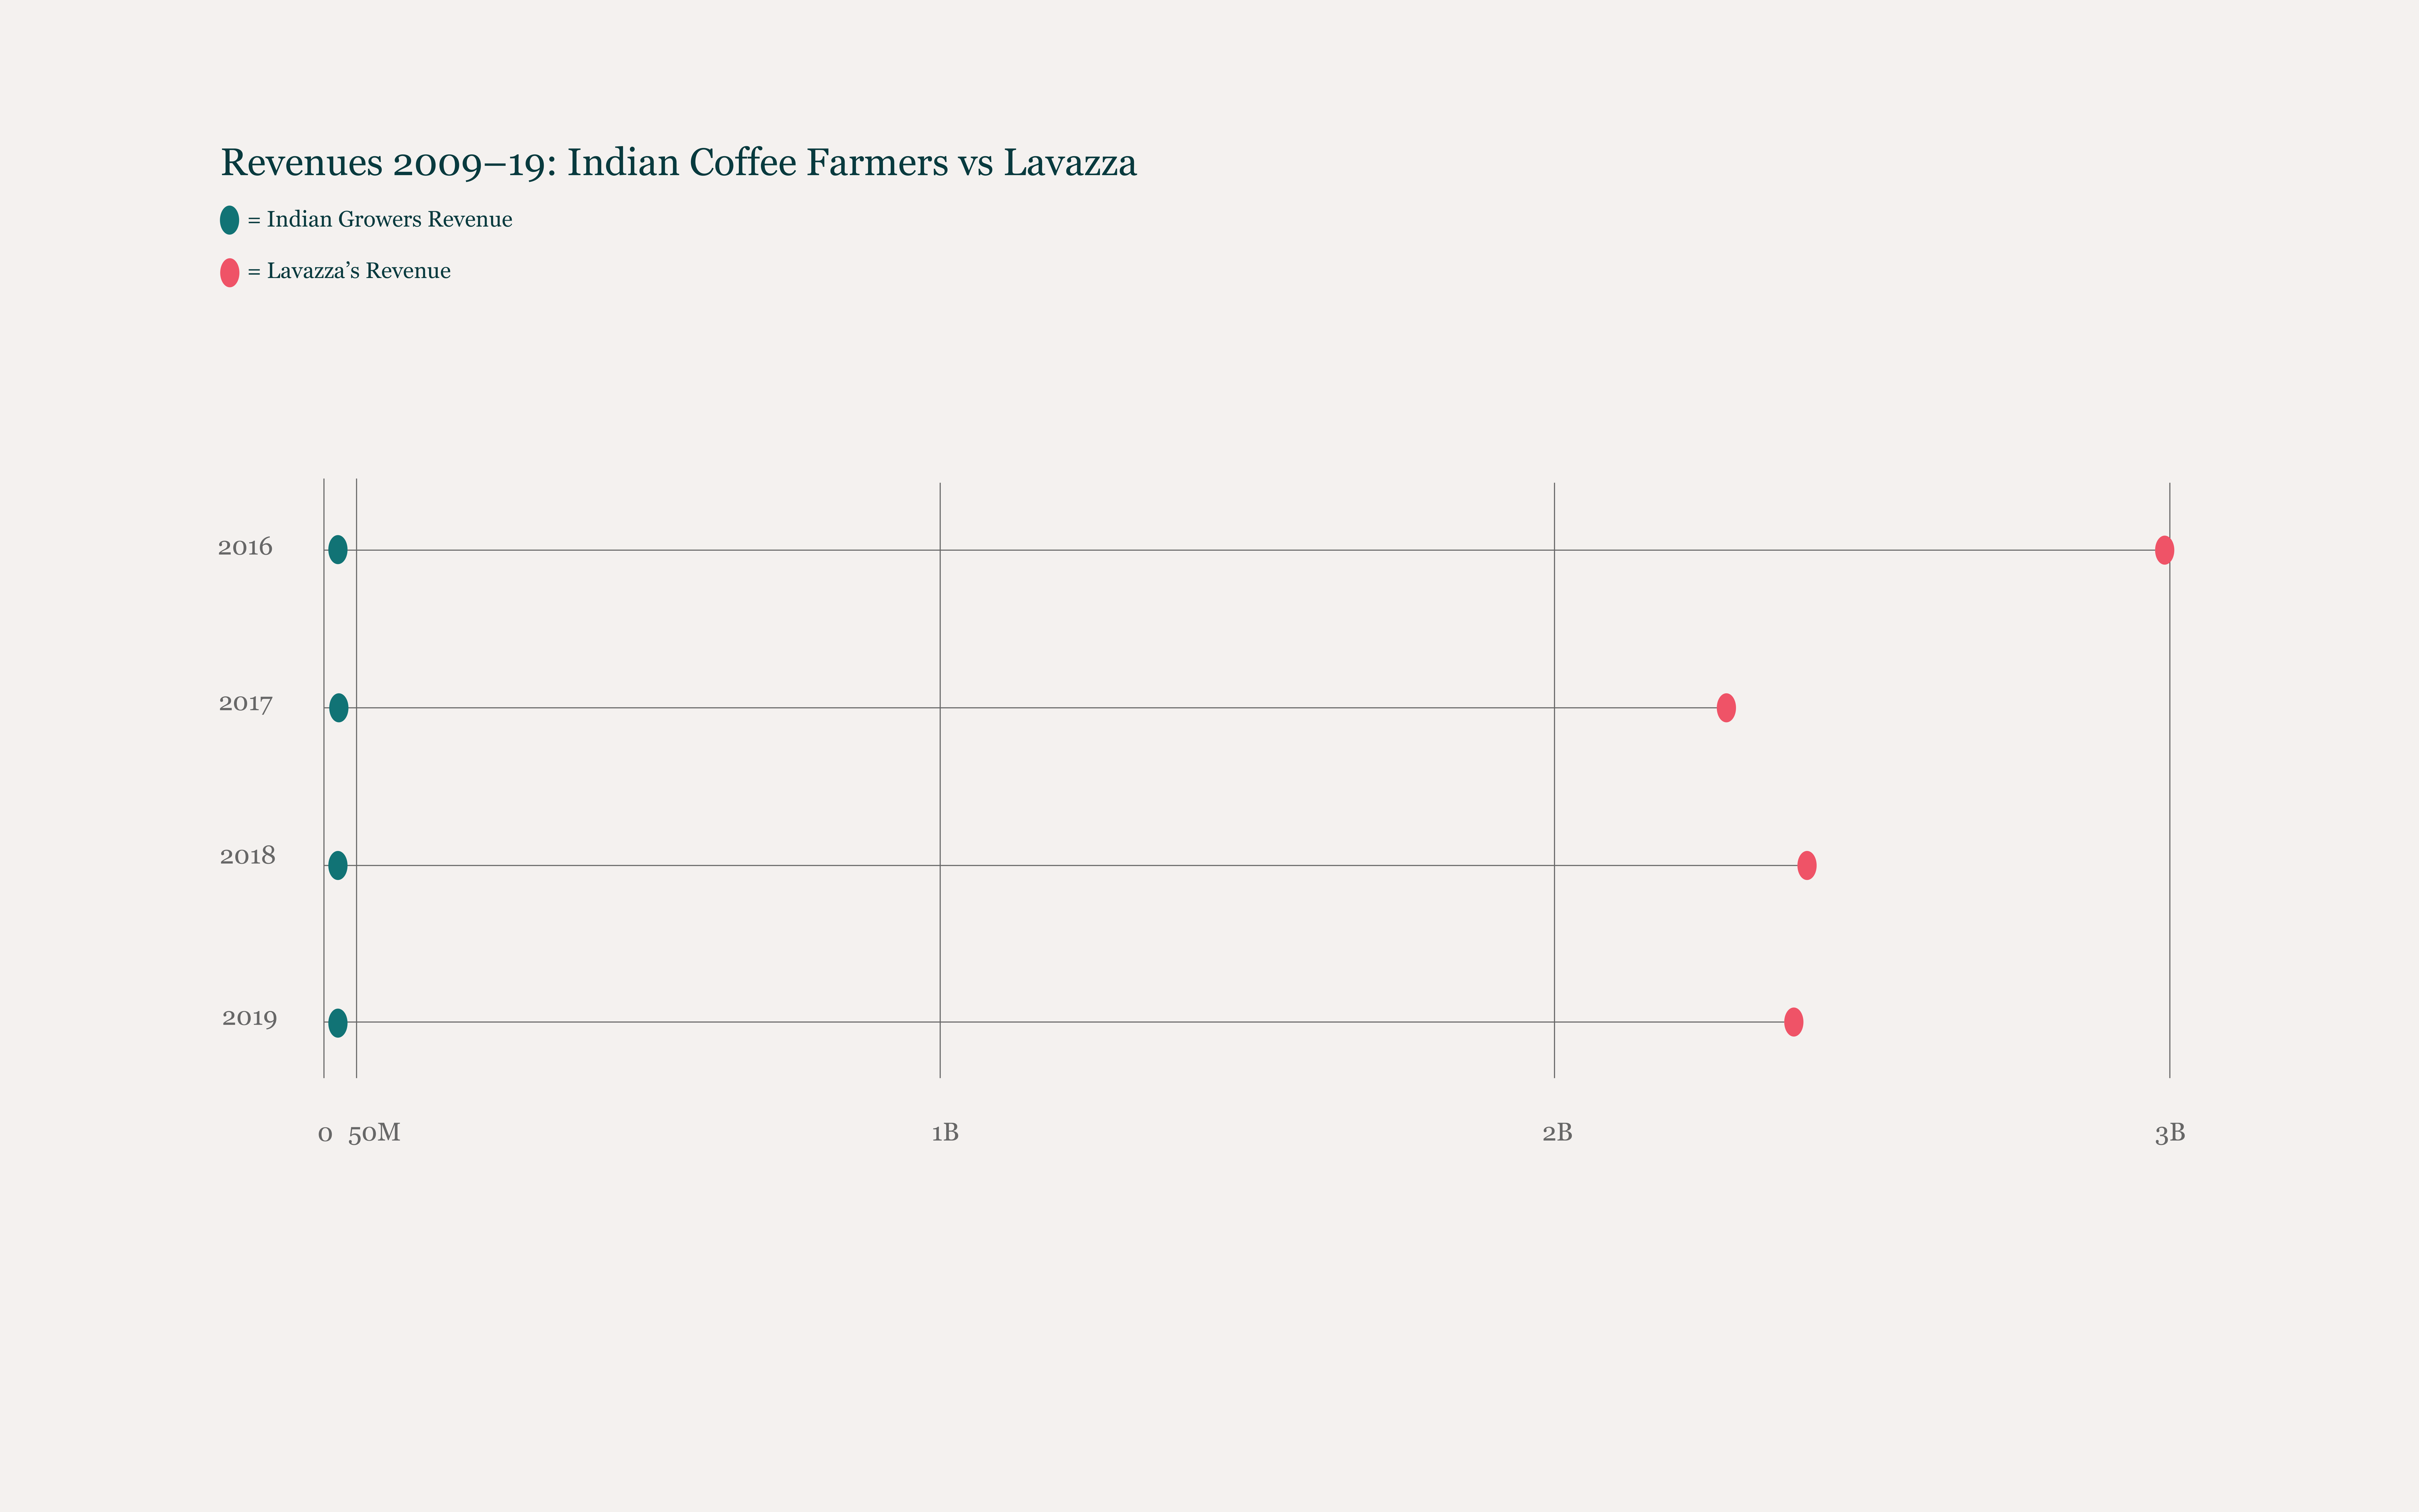
Out of all the coffee companies in Italy, Lavazza is the leading one, earning billions in its revenues. Lavazza is also one of the largest coffee companies in the world after Nestle and Starbucks. I found Lavazza’s total revenue from 2016-2019 on the Statistica website which contains lots of business data sets. Using that and the revenue values of Indian coffee growers from the previous line area chart, I made a range plot graph. This type of graph shows range differences between values so I feel it works with my aim to portray huge differences. Unlike line graphs, this type of graph can visually accommodate this particular dataset without having to make the chart so enormously long that the users just keep scrolling!
Findings
The difference in revenues between Indian growers and Lavazza is extremely high. While the value of all Indian coffee farmers altogether collectively falls under 50 million, Lavazza’s earnings go all the way to 3 billion SGD. For each year, the length of the line between the green and red beans indicate the difference in revenue values.
The largest difference is in 2016, after which Lavazza’s revenue remains under 3 billion whereas Indian coffee growers’ revenue consistently remains under 50 million between 2016 to 2019. While this graph is comprehensible, it may not give the most accurate depiction of the huge differences as these lines are condensed in length. In the Artefacts section ahead, I have used different ways to explore and showcase the large differences in the values.

Insights
The main insight is that the source does not earn nearly as much as the final destination, which may be big companies that profit from cheaper sourcing. The export of coffee comes from the southern hemisphere whereas the imports happen more from northern hemisphere countries. This justifies how India’s biggest importers are European countries.
Next, the coffee export and revenues for Indian farmers have increased a lot since 2009, but seen ups and downs in more recent times. The 2019 levels of both exports and revenues have fallen down since the 2017 peak levels. This also showcases the correlation between growing coffee and earning from it. Lastly, the revenue earned by Indian coffee farmers collectively is not nearly even half of what Lavazza has earned over the years, which can be quite surprising.

Conclusion
In conclusion, it is mind-boggling that the people solely responsible for growing coffee get the tiniest amounts of earnings compared to bigger companies. While this may be unfair for the farmers, the socio-economic sphere of the coffee product is structured in such a way that consumers find it easier to buy readymade coffee compared to getting it from a direct source. Companies like Lavazza have products, marketing campaigns, apps, etc to make the coffee accessible. Furthermore, we should also understand that employees of Lavazza would also span across different socio-economic levels. At the same time, it is important to acknowledge the big divide of revenues to empathize with the farmers who do not earn as much.
References
- “Create Charts, Maps, and Tables.” Datawrapper, 11 Aug. 2021, https://www.datawrapper.de/.
- “Historical Data on the Global Coffee Trade.” International Coffee Organization - Historical Data on the Global Coffee Trade, https://www.ico.org/new_historical.asp
- “India Coffee Exports: Quantity: Spain.” CEIC, https://www.ceicdata.com/en/india/coffee-exports-quantity/coffee-exports-quantity-spain.
- “India: Coffee Export Value by Country 2020.” Statista , 23 Apr. 2021, https://www.statista.com/statistics/624584/export-value-of-coffee-by-country-india/.
- “India's Coffee Exports Witnessing Decline, Hit 9 Year Low in Dollar Value Terms in Fy20: Report.” The Economic Times, https://economictimes.indiatimes.com/small-biz/trade/exports/insights/indias-coffee-exports-witnessing-decline-hit-9-year-low-in-dollar-value-terms-in-fy20-report/articleshow/84668004.cms.
- Zein, Zafirah. “The Origins of Coffee in Asia.” Kontinentalist , 29 Apr. 2021, https://kontinentalist.com/stories/are-coffee-trade-markets-in-asia-sustainable-and-ethical.